
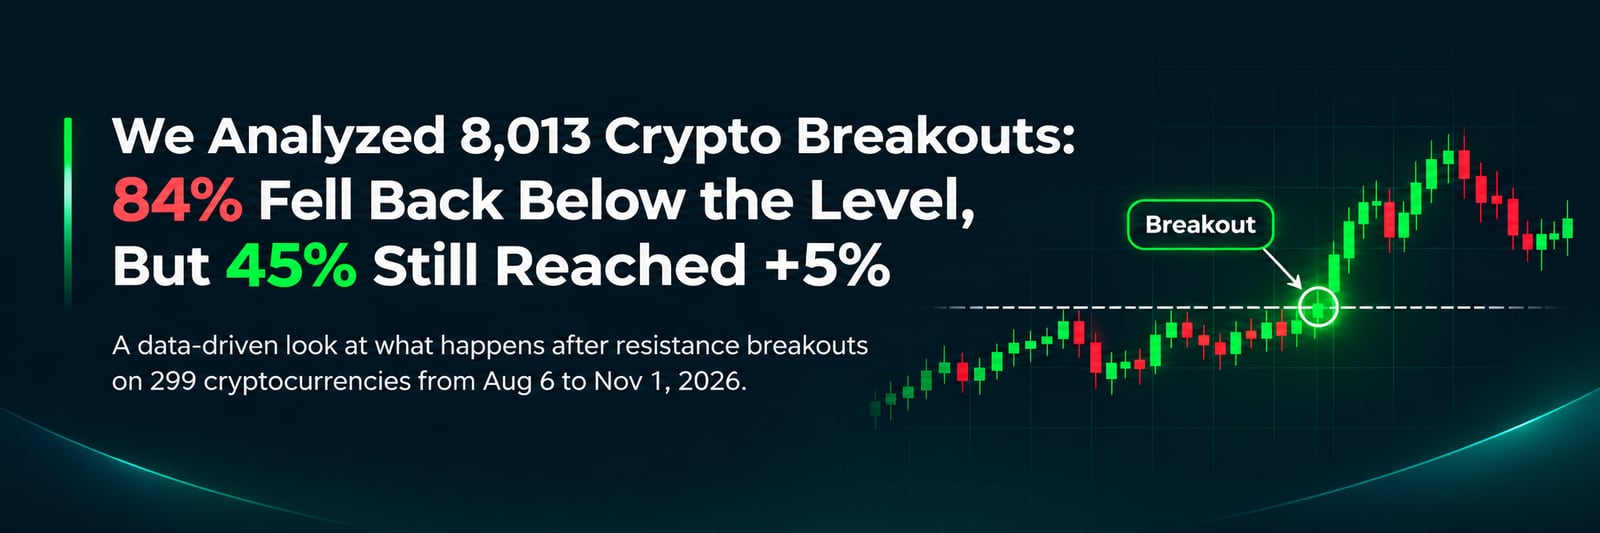
We Studied 8,013 Crypto Breakouts. Most Fell Back Below Resistance — But That Wasn't the Whole Story.
What happens after a crypto breakout? We tracked 8,013 resistance breakouts on Binance futures for 24 hours: how often they fail, how far they run, and why.
I've been looking at resistance breakouts a lot lately, partly because we've been building tools to detect them in CryptoVigil. One question kept bothering me: once a coin finally closes above resistance, what usually happens next? Not in those perfect examples where someone draws an arrow on a chart afterwards. I wanted to see what actually happens across thousands of breakouts, including the messy ones.
We examined 8,013 upward breakouts across 299 crypto assets, using Binance USDT perpetual futures data from August 6 to November 1, 2026. For each breakout, we tracked what happened during the next 24 hours.
The first result was pretty brutal: 84% of breakouts closed back below the level at least once within the following day. More than half did so in the very next hour. That sounds like a good argument against trading breakouts — until you see the other side of the data. 45% of those same breakouts also reached at least +5% from the breakout closing price. Almost one in four reached +10% or more.
In other words, a breakout could fail to hold resistance and still produce a substantial move. We tend to use "false breakout" as shorthand for "nothing happened." These numbers suggest that's a mistake.
The first few hours tell a very different story from the daily close
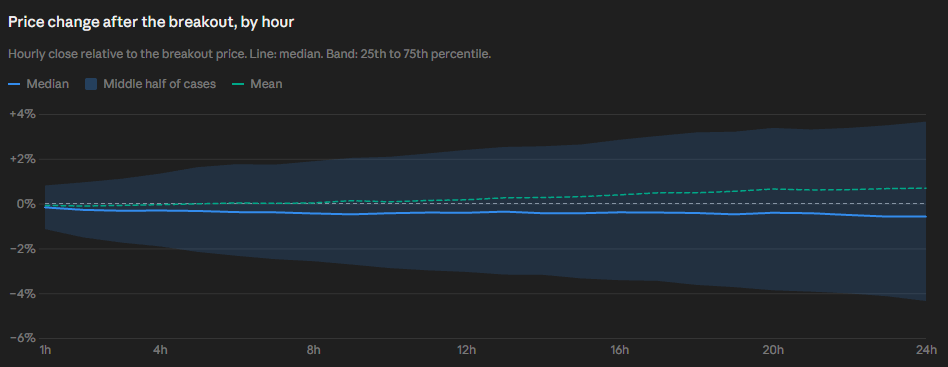
The typical price path after a breakout wasn't particularly bullish. On the next hourly close, the median change was already −0.2%. At the end of 24 hours, it was −0.6%. The average, however, ended at +0.7%, pulled higher by a smaller number of very large moves. The middle half of all outcomes spread out considerably over the day, finishing between −4.4% and +3.7%.
There's another way to look at this. At the close of the first hour, 52% of all breakouts were already back below the resistance they had just broken. After that, the share sitting below the level stayed around 52–55% for most of the next 24 hours. The line hardly moves, even though individual coins keep crossing above and below their levels.
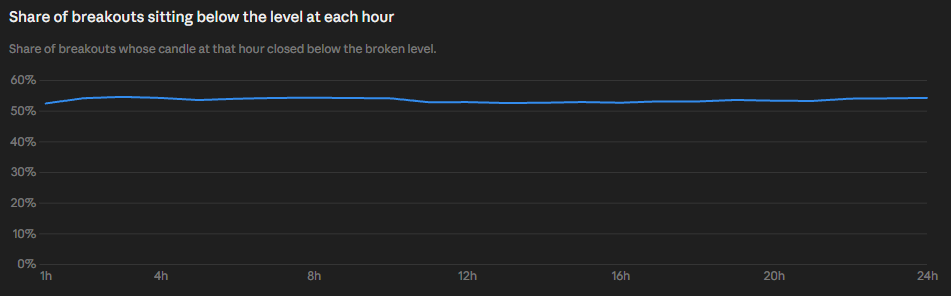
That chart shows the share below resistance at each particular hour. It is not the same as the 84% figure, which counts every breakout that went below the level at least once during the entire day. Both are true; they describe different things.
And price often had a chance to move before it came back. Across the full sample, 71% of breakouts reached +2% at some point, 61% reached +3%, 45% reached +5%, 23% reached +10%, and 9% reached +20%. The median of the highest prices reached during the day was about +4.3% above the breakout close.
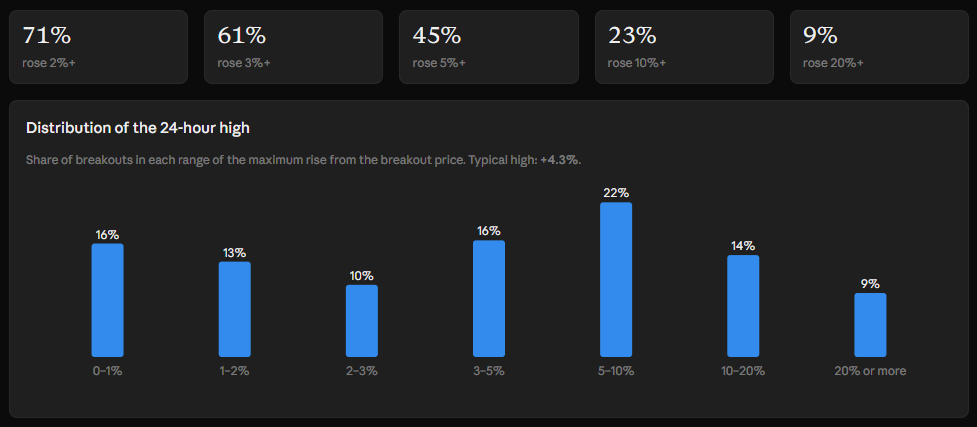
Of course, these are the highs we can identify afterwards. Nobody gets to know the maximum in advance. Those figures describe how far prices travelled, not what a real trader could have earned.
What about the return below resistance? It happened to 6,723 of the 8,013 breakouts. Among those returns, 62% first occurred in the very first hour. Another 12% happened in the second hour. By the time three hours had passed, most of the returns that would happen during the day had already happened.
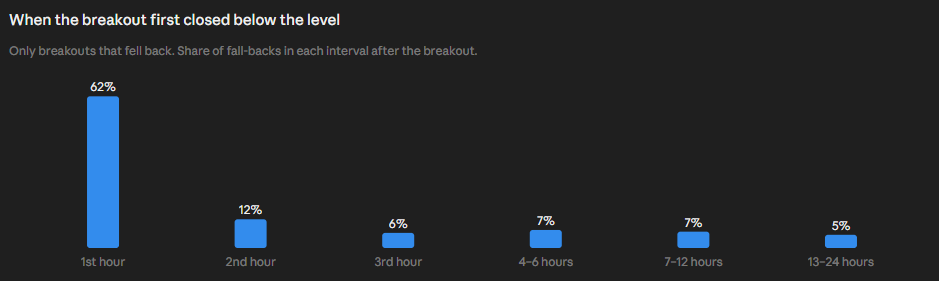
That still doesn't mean all those breakouts offered no upside. Among the ones that eventually fell back below resistance, 25% had already gained at least 5% from the breakout close before the first return. We checked one smaller move too: in 29% of all breakouts, +3% came before the return below resistance; in 66%, the return came first. Another 4% recorded both events within the same hourly candle, so we couldn't tell which came first.
The daily closing results bring us back down to earth. After 24 hours, 54% were below the original breakout closing price. Moderate losses occurred more often than moderate gains, even though a few big upward moves made the overall average positive.
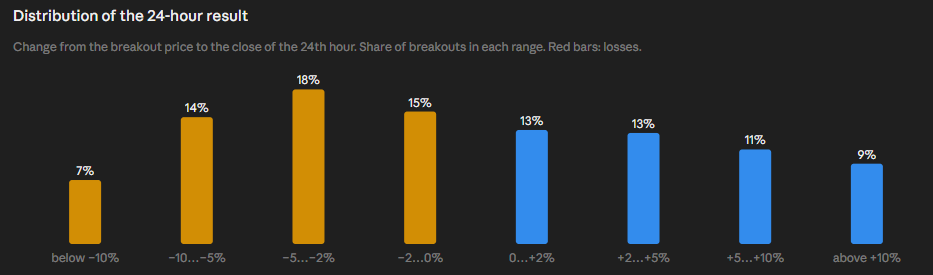
This is why I'm reluctant to judge a breakout by a screenshot taken the next morning. A coin can make a sharp move, fall back below resistance, and finish the day red. All three things can happen in the same tradeable-looking event. A breakout is not automatically a new trend.
The market around the breakout mattered a lot
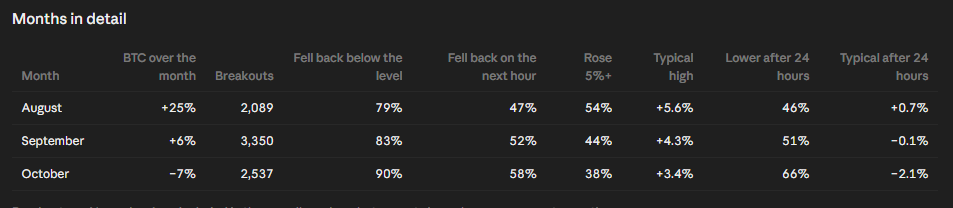
The difference between August and October was hard to miss. Bitcoin gained roughly 25% in August and fell about 7% in October. We kept the same level detector and breakout rules throughout, but the results changed dramatically.
In August, 54% of breakouts managed at least +5% within the next day, and 46% finished below the breakout closing price. In October, only 38% reached +5%, while 66% finished below the breakout price. The share that returned below resistance at least once went from 79% to 90%.
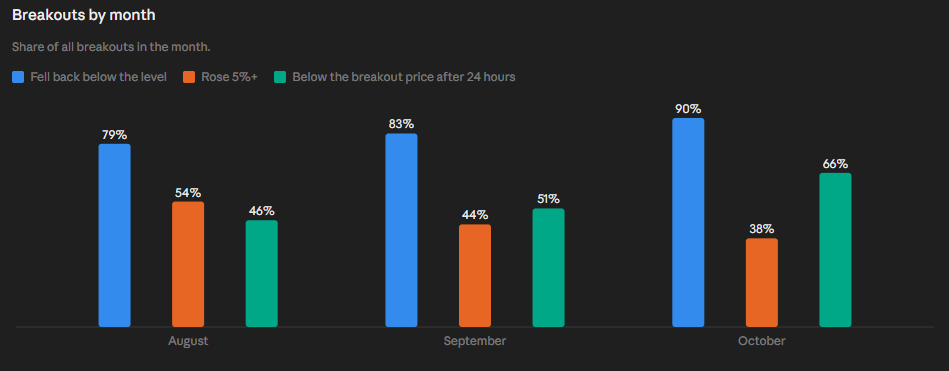
Looking at the month-by-month figures makes the shift clearer. August had a median 24-hour result of +0.7%. September was nearly flat at −0.1%. October was down to −2.1%. It wasn't just that big moves became less frequent; the usual outcome after the breakout was getting worse.
And it shows up in the actual path of the median breakout. During August, it recovered after the early wobble and finished slightly positive. During October, it continued drifting lower through the day. Same kind of breakout, very different backdrop.
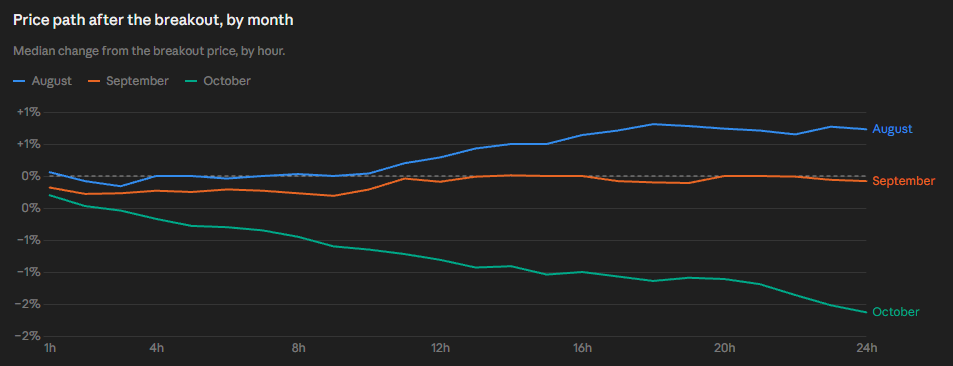
Three months aren't enough to claim Bitcoin alone caused this. A lot of market conditions changed together, and many of these coins move in the same direction. But I'd be careful about anyone saying a breakout pattern "works" or "doesn't work" without first asking what sort of market they tested it in.
A strong candle and strong volume aren't the same as a good entry
We also grouped breakouts by how far above resistance the breakout candle closed. The results are a good example of how a statistic can look bullish until you ask a second question.
When the candle finished less than 1% above resistance, 41% of cases went on to reach +5%. If the breakout candle closed 7% or more above the level, that number jumped to 81%. Those larger candles also returned below resistance less often.
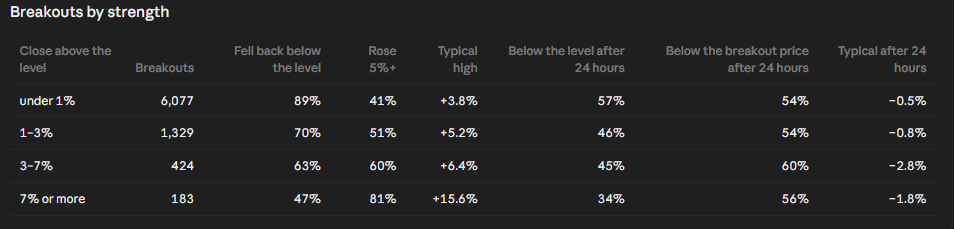
Sounds convincing. But if you measure the next 24 hours from the close of that already-large candle, the median return was −1.8% in the 7%+ group. For candles closing 3–7% above resistance, it was −2.8%. A big part of the excitement was already behind you by the time the candle closed.
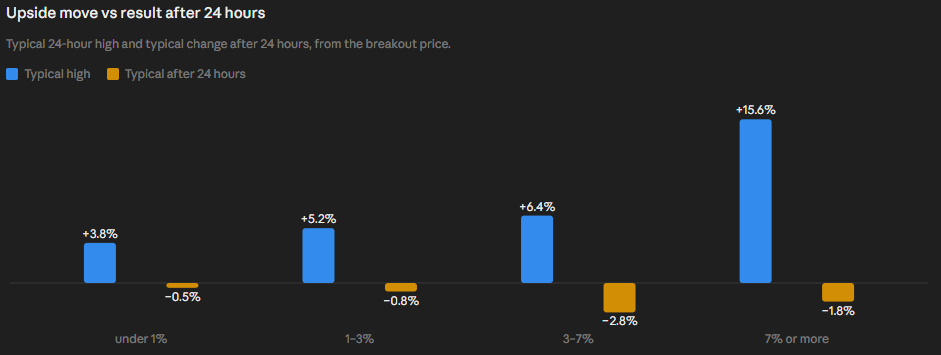
That doesn't mean a strong breakout is always a bad setup. It means "this candle was strong" and "buying after it closed would have been attractive" are two very different claims.
Volume told a similar story, but with its own twist. We tagged breakouts where trading activity in the six hours before the breakout was unusually high compared with the previous week. In that group, 57% went on to reach +5% within a day. Without elevated volume, only 39% did. Strong volume was associated with more big upside moves, including moves of +10% or more.
Yet 54% in both groups were below the breakout closing price after 24 hours. The median 24-hour result was slightly negative in both groups too.
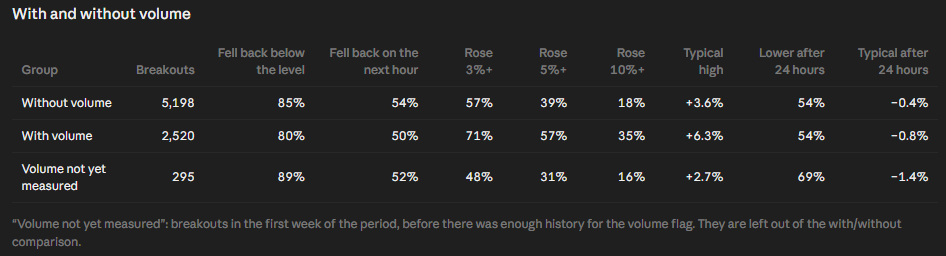
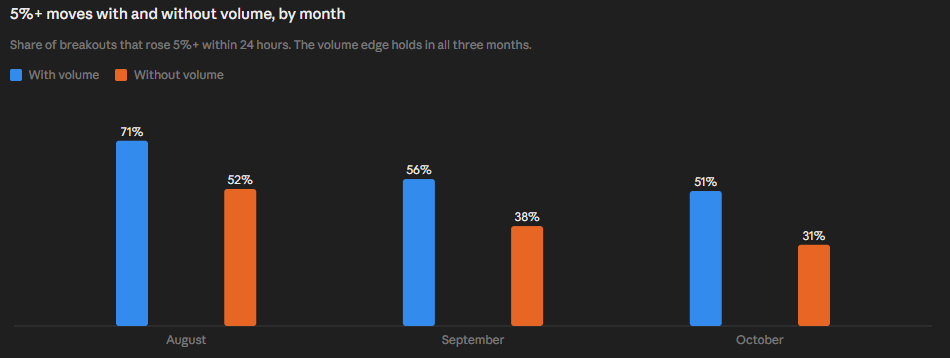
What makes the volume result more interesting is that the difference in reaching +5% appeared in each individual month, not just in the strongest market. It was 71% versus 52% in August, 56% versus 38% in September, and 51% versus 31% in October.
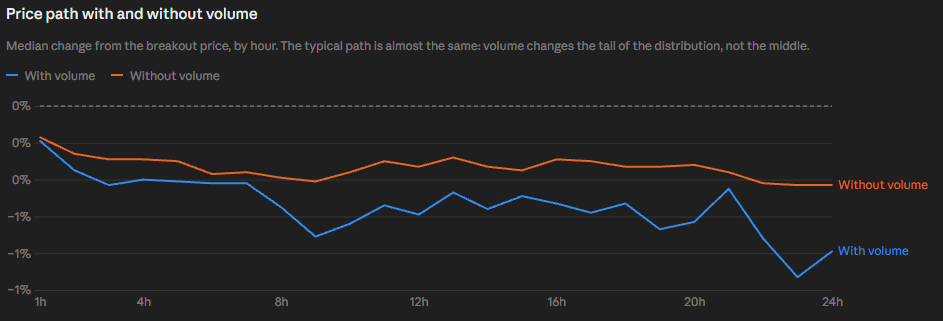
But look at the median path across the day. The higher-volume group didn't finish better. If anything, its typical result was a little worse. Volume seemed to change the chance of seeing a substantial upside spike, not the tendency for the average breakout to hold its gains.
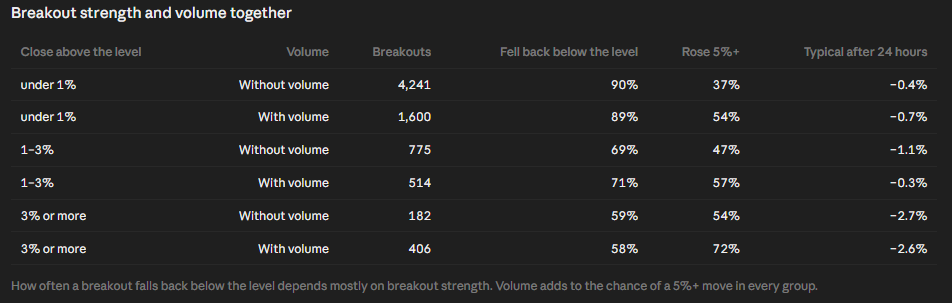
We also checked volume and breakout-candle strength together. Elevated volume was associated with a higher chance of reaching +5% even within the same candle-strength ranges. The chance of falling back below resistance, on the other hand, changed much less. These two measurements seem to be telling us different things about the move.
What did the level itself tell us?
There's a popular trading rule that more tests of resistance make the eventual breakout more meaningful. We looked at the number of previous touches in our detected levels. The result wasn't what that rule would lead you to expect.
With one previous touch, 46% of breakouts reached +5%. With two touches, it was 38%. With three or more, it was 34%. Returns under resistance were almost unchanged across the groups: 84%, 83%, and 81%.

I wouldn't call that the death of the "third touch" idea. Only 117 breakouts in this sample involved levels with three or more previous touches, and the detector picks up many local swing highs rather than just big multi-month levels. Still, it's a good reminder that a familiar chart rule is not the same as a tested statistical advantage.
Liquidity offered another useful distinction. Markets with moderate-to-high daily turnover were more likely to see a +5% move after the breakout than the quietest markets. In the $20 million–$100 million turnover group, 54% reached +5%, compared with 40% among markets below $1 million. At the very top, above $1 billion turnover, the number fell to 27%, but that group was small and included a different mix of assets.
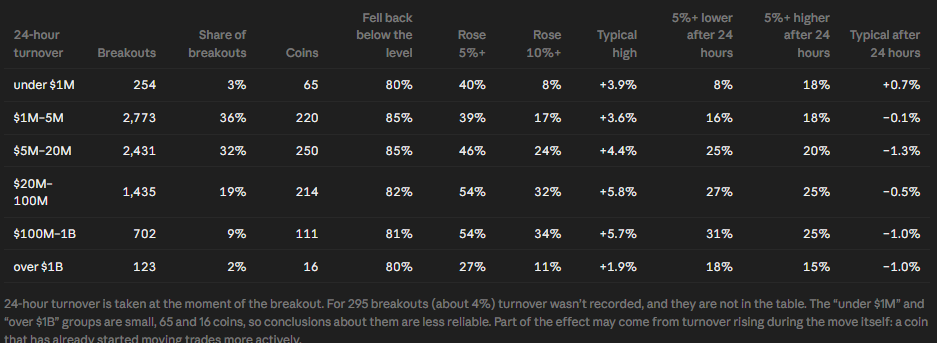
I wouldn't turn that table into a universal rule about liquidity. Turnover was measured at the breakout, and some of the activity may have risen because the coin was already moving. It does show why a 5% move means very different things in a thin altcoin and a giant market.
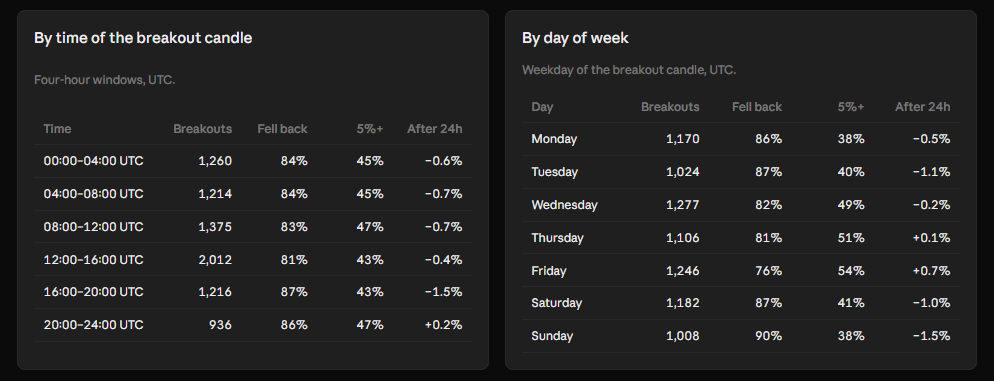
We also checked the time of day and day of the week. Friday looked better than Sunday in this short sample, and the time-of-day figures weren't completely uniform either. But with only about three months of data, it would be easy to mistake a few unusually active days for a lasting seasonal edge. I see these as ideas to investigate, not rules to trade.
Finally, we repeated a shorter version of the study on Bybit futures over the overlapping August 5–October 4 period. The results were almost identical to Binance for the same window: 81% of breakouts returned below resistance on both exchanges, and 49% reached +5% on both.
| Exchange | Breakouts | Fell back below the level | Below the level after 24 hours | Rose 5%+ |
|---|---|---|---|---|
| Binance | 5,266 | 81% | 49% | 49% |
| Bybit | 5,414 | 81% | 48% | 49% |
This is a useful cross-check, not independent proof. The exchanges trade many of the same coins, and those coins react to the same market events.
What I take from all this
I started with a fairly simple question: when resistance breaks, how often does price keep going? The answer turned out to be less tidy than I expected. The move after a breakout was often real enough to get your attention, but it told us remarkably little about where price would finish the following day.
Some findings made sense. Higher volume was associated with a better chance of seeing a large move. The wider market made a huge difference. The first few hours mattered a lot. Other results gave me pause, especially how little support we found for the idea that more prior touches automatically make a better breakout.
I don't think this proves breakouts are bad. It definitely doesn't prove there's easy money in betting against them. A breakout is a market event, not a complete trading strategy. Where you enter, what you do after the move, what the rest of the market is doing, and what you risk along the way are all missing from a simple breakout statistic.
The point of running these studies is to test things we normally accept because they look convincing on a chart. Sometimes the numbers agree. Sometimes they make the story a lot less comfortable. I find the second kind of result more useful.
About the data
We used hourly candles for 8,013 upward resistance breakouts across 299 Binance USDT perpetual-futures markets from August 6 through November 1, 2026. A breakout required an hourly close at least 0.2% above a level found by CryptoVigil's detector. A "return below the level" meant at least one hourly close back below it within the next 24 hours. The last incomplete 24-hour windows were excluded. Elevated volume was measured relative to the preceding week's trading activity.
This is descriptive price research, not a strategy backtest or a record of achievable returns. We didn't model trading fees, slippage, execution delays, or exits; the intrahour order of events is sometimes unknowable from hourly candles. Breakouts aren't independent either, since a market-wide move can trigger many coins at once. The sample is short, and other periods or level-detection methods could give different results.
Turn raw trade history into usable feedback
CryptoVigil helps you import, review, and group your Binance Futures trades so your journal becomes a decision tool, not just a list of old positions.